itelligent-i conduct a Corporate Business Intelligence Review which helps organisations see the potential of their data asset. It also highlights their current challenges and provides a roadmap for driving towards maximising their data asset.
itelligent-i is a data and analytics consultancy, providing the right information to the right people at the right time. We implement the latest technologies from leading vendors, providing data architecture for entire organisations. itelligent-i develops diagnostic (profiling) and predictive analytics to gain maximum insight into your particular organisation and also support our customers in developing data strategies which include:
- Designing and embedding new ways of working
- Data governance
- And building organisational structures.
All enable them to continue their data journey in a secure and risk controlled environment.

In a series of short blogs, we’re going bring you an overview of our last 7 reviews (conducted over 2 years) offering our insights and showing the difference we can make.
Local authorities are making great strides toward efficiency and effectiveness, yet the ones we meet with (38 local authorities in 2017/2018) are all initially struggling to understand how their data can be used to enhance and develop services.
Most Local Authorities are tied up in producing simple datasets and reports. They mostly export from individual systems into Excel, mashing up the data and manually addressing data quality issues to provide statutory reporting. At best however, this only gives them simple, descriptive analytics (a snapshot of numbers at a point in time). It also takes an excessive use of resources and thousands of hours of manual effort. Even when we see technology utilised, there is still the same manual extraction and cleansing exercise due to the lack of skills and knowledge to truly automate.
Because we can help fully automate these manual processes, an organisation’s analysts can free up this time to spend on actually analysing the data. We’ve delivered for customers, so I can say so.
As mentioned we’ll explore this more throughout the coming blog series. But for now, here’s a blueprint of what challenges an organisation faces…
 As an average, our in-depth Corporate Business Intelligence Review (CBIR) has found that Local Authorities are currently spending between £1 million – £1.9 million per annum on resources, just to produce basic descriptive data reports. But Senior Management Teams (Directors, Assistant Directors, etc.) and their direct line reports have told us that they need in excess of 450+ ‘new’ insights to effectively make decisions and run the organisation. (Only 1 report was less, at 285. But we were only allowed to talk with 50% of the business areas! – This will link to another blog in the series). What was really telling though, is the number of reports produced that don’t get used, due to the effort which senior and operational managers have to put into turning this data into insights.
Making the most out of your data requires an investment, which is currently being made but perhaps not quite focused in the right way. Let me explain…
It’s not just about automating manual effort but also about providing good (diagnostic) and advanced analytics to the right people at the right time. Which is fully automated. We’re currently working with a number of Local Authorities, of all tiers, who have recognised how they will be better informed by properly investing in their analytics for developing insights. It enables them to redesign services and identify savings that are currently difficult to find without the right analytics; this ultimately leads to better outcomes for the communities Local Authorities serve.
It’s no small investment and when we talk to authorities for the first time, we’re very open about what that investment looks like. What does surprise me, again and again, is that Local Authorities are willing to spend well in excess of £100,000 pounds for a set of ‘out of the box’ reports provided by system vendors. But this doesn’t resolve the manual effort I’ve discussed. In fact, in nearly every case it increases the effort. Nor does it provide the reports needed as most often data is required from multiple systems, partners, geographical references, gazetteers and open source information.
The more systems you buy, or implement, the greater the resource and associated cost of extracting the data, and mashing-up the data in Excel. Worse still, the ICT budget just increases without consideration (because you need servers, implementation, architects time, etc). And don’t forget about ongoing maintenance!
Just count your major systems; through our reviews I can tell you that councils extract data from upwards of 55+ systems to provide simple reports. But even just your core systems reporting tools will be costing hundreds of thousands in annual maintenance alone. The numbers just keep adding up.
However, cost to one side…
Every Local Authority needs to know about itself and its own services and activity, and stop basing all of its findings on Central Government averages. Central Government publish poignant information which should be used to guide an Authority to validate their locality. This can only be done with locally held data. With the right analytics, you can just drill down into your data to provide a horizontal view of your organisation with a few touches on your device or clicks of your mouse.
An understanding of Local Authorities from within is very rarely based on fact. Often a piece of data published by Central Government from 10 years ago is still being quoted. Or a consultancy was paid for a report that took 12 months to generate and which was most likely out of date before it went to print.
You can have your data now updated every night for the whole business. In fact, you can view your information from your device on your way into work or during your morning coffee, as I do with my own business. I get instant notifications of any issues automatically, and I’m able to review progress and identify where we can do better. I even get a full progress update of all my customers project on a Saturday morning which I review over morning coffee (ask my staff, I really do!)
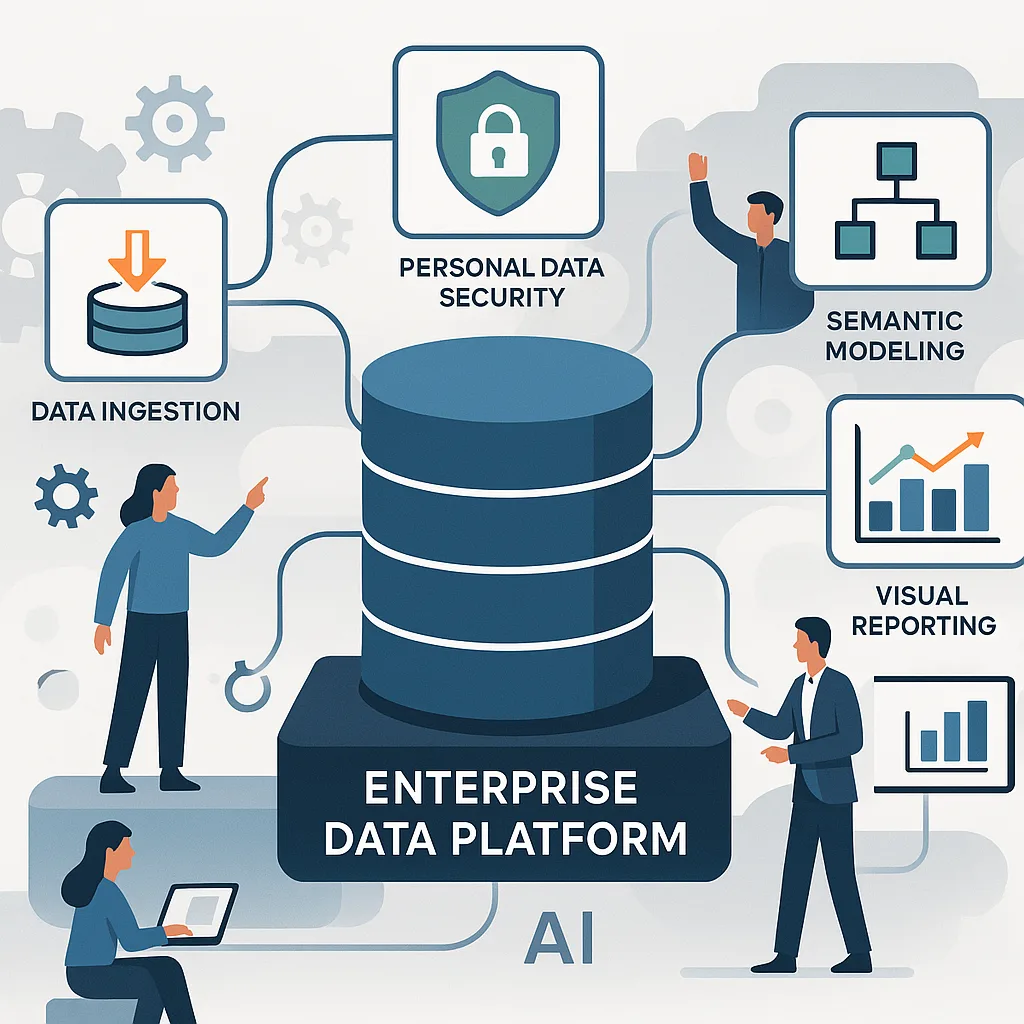
At this point, you’re probably saying, “But what about GDPR? What about Data Quality?” Etc. Well this is where I designed itelligent-i’s Information Strategy, a methodology for maximising your data asset, ensuring you and every member of your business, partnerships and commissioned functions can securely access and visualise data at the right time. It covers description, diagnostic and predictive analytics and sets you up for genuine AI. It ensures that data quality is addressed and data is securely provided. In fact, security with full auditing is implemented so we can see who has access to, and has viewed/accessed what data via any means. It also provides the ways of working for your staff and how to structure your business to manage data in order to maximise its use across the organisation with minimal risk.
In the next article, I’ll discuss what analytics are needed to support service redesign. And I’ll be asking itelligent-i’s Analytics Director, Susie Bentley and Principal Consultant Paul Kearsey, to share their thoughts with us.
Make sure you follow us to see when the next article is released…